
Articles › BSR & Sales Data
What Is a Good BSR? Amazon Best Sellers Rank Explained for Authors
Published 27 June 2026 · KDP Metric team
Every book on Amazon carries a number that tells you, at a glance, how well it's selling: the Best Sellers Rank, or BSR. It's the single most useful public data point for niche research. It's also one of the most misread, partly because so much of what circulates about it is folklore rather than anything Amazon has actually said.
So let's do this properly: what BSR measures according to Amazon's own documentation, what counts as "good", and how to turn a rank into a rough sales picture.
Where to find it
Scroll down any book's product page to the Product details block and you'll find something like this:
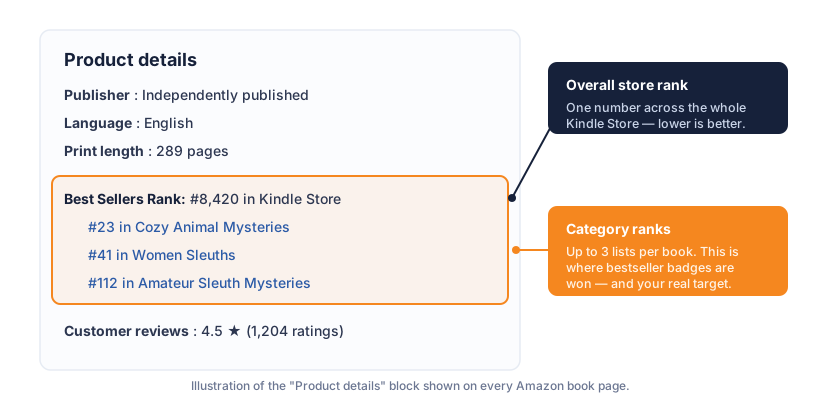
Notice there are two kinds of rank in that block, answering different questions. The overall rank ("#8,420 in Kindle Store") compares the book against everything in the store. That's your demand signal. The category lines beneath it ("#23 in Cozy Animal Mysteries") compare it within specific sub-categories, and a book can appear in up to three of these lists. The category lines are where the orange bestseller badge gets won, which is a topic of its own.
What Amazon actually says about BSR
Amazon documents sales rank in its KDP help pages, and the documented facts are worth quoting because they contradict a lot of received wisdom:
- "Best Sellers and Category Ranks are based on customer activity of your book relative to the activity of other books." Lower is better; #1 is the top seller.
- "Rankings are updated at least once per day, but changes may take up to 2 days to appear." Not hourly, whatever the forums tell you.
- "Rankings reflect recent and historical activity, with recent activity weighted more heavily." A book with a long sales history falls more slowly than a one-day spike rises.
- Rank is relative. Your number can move even when your sales don't, because the books around you sped up or slowed down.
- Every format ranks separately. Your Kindle edition, paperback, hardcover and audiobook each carry their own independent BSR, so a paperback rank tells you nothing about ebook demand.
- Free and paid are separate lists in the Kindle Store, and free promo downloads don't count toward paid rank.
- Cancelled orders and similar non-demand activity are excluded.
So what counts as "good"?
Amazon publishes no sales figures, so there's no official conversion table. But the rank-to-sales relationship follows a rough power law that self-publishing educators have triangulated over many years, and it's good enough for sizing decisions as long as you treat every figure as a wide band rather than a fact. Our extension's model uses a ±40% band, and these anchors:
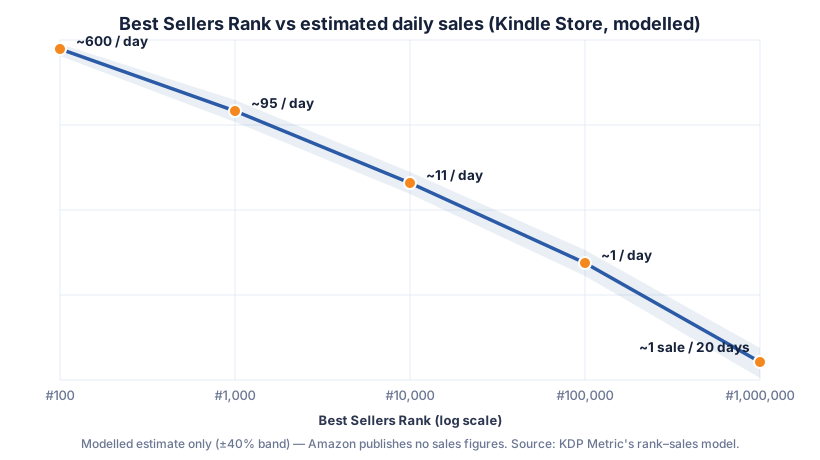
As a practical reading guide for the US Kindle Store:
| BSR (Kindle) | Rough daily sales* | What it means when researching |
|---|---|---|
| Under 1,000 | ~95+ | A genuine hit with sustained demand |
| 1,000 – 10,000 | ~11–95 | Healthy, full-time-income territory |
| 10,000 – 50,000 | ~2–11 | Steady mid-list seller |
| 50,000 – 100,000 | ~1–2 | Ticking over at about a sale a day |
| 100,000 – 500,000 | under 1/day | Occasional sales |
| Over 500,000 | a sale a week or less | Effectively dormant |
*Modelled estimates interpolated from publicly circulated anchor points. Other marketplaces and categories differ. Use them to compare, never to promise revenue.
For niche research the question isn't really "is this book's BSR good?" but "what do the ranks across page one say about the niche?" Top organic results under ~50,000 means real money flows through this search. Winners sitting past #300,000 means the niche can't feed a new entrant, however beatable the competition looks.
Why "relative" is the word that trips people up
The single most misunderstood thing about BSR is Amazon's own point that it's relative. Your rank compares your recent activity against everyone else's recent activity, so it can move for reasons that have nothing to do with you.
A worked version: suppose your book sells exactly five copies a day, every day, for a month. Your sales are flat. Your rank will still wobble, sometimes a lot. In a quiet week, when the books around you slow down, five sales a day might carry you to #18,000. In a busy week, or during a genre promotion where rivals are all discounting, the same five sales might leave you at #31,000. Nothing changed on your side. The neighbourhood did.
This has two practical consequences. First, don't panic at a rank drop or celebrate a rank rise without checking whether your actual sales moved, which your KDP dashboard shows and the public rank does not. Second, when you compare two books' ranks, you're comparing their recent momentum, not their lifetime success. A book that has sold a hundred thousand copies over five years but had a slow month can rank below a three-week-old debut that's selling well right now.
Where Kindle Unlimited fits in
For books enrolled in KDP Select, Kindle Unlimited borrows count toward sales rank alongside paid purchases, which is why a book priced at £0.99 in a KU-heavy romance niche can rank far better than its list price alone would suggest. The reader borrowed it rather than bought it, but Amazon still registers the activity.
This matters when you research KU-dominated genres like romance, or fantasy. The BSR you see reflects borrows plus sales blended together, so the rank-to-sales estimates in the table above (which assume paid purchases) will overstate the money a given rank represents in those niches, because a chunk of that "activity" is page reads paying out from the KU fund rather than full-price sales. It's not a flaw in reading BSR, just a reason to know which kind of niche you're looking at before you translate rank into revenue.
Overall rank versus category rank, one more time
It's worth being clear about the two numbers, because authors routinely quote the wrong one. The overall Best Sellers Rank is the big one at the top of the details block, and it measures the book against the entire store. The category ranks below it measure the book only against others in that specific sub-category.
The two can look wildly different, and both are honest. A book can be #40,000 overall (steady but unremarkable) while being #3 in "Cozy Animal Mysteries" (a small category where modest sales are enough to lead). That's not a contradiction. It's the whole reason category selection matters so much: the overall number reflects raw demand, while the category number reflects how you stack up in a pond you chose. When someone shows off a "#1 Bestseller" badge, it's almost always a category rank, and the size of that category is what tells you whether the badge was hard-won or handed out.
 Add to Chrome — it's free
Three ways people misread BSR
Judging a niche from one book. A single rank might be a launch spike, a price promotion, or a BookBub feature from last Tuesday. Read several books and take the median; that's the niche's actual pulse.
Comparing across stores or formats. #20,000 in the Kindle Store and #20,000 in printed Books are different demand levels, and formats rank independently. Always compare like with like.
Treating a snapshot as a trend. One look can't tell you whether a book is climbing or dying. The honest signal is rank history over days and weeks, which is why KDP Metric lets you track any book and builds crowdsourced rank and price history over time, free.
Read BSR as a flow, read it in groups, and translate it with some humility about the error bars. Do that and one number on a product page becomes the backbone of your research.
Add to Chrome — it's free